Next Generation Response from Google Enterprise
The latest Google asset we’ve made available: an infographic, “Next Generation Emergency Response from Google Enterprise.”
The New Norm: Work the Way You Live
According to a Forrester research study, 53% of employees are already using some form of consumer technology to get their work done. The question that arises is: how can federal agencies encourage better collaboration while improving productivity and reducing costs?
Potential Syrian Missile Targets Pinpointed in Google Earth
As the U.S. government continues the debate about potential strikes against the Assad regime in Syria, GIS professionals are busy mapping out potential missile targets in Google Maps and Google Earth.
ForeignPolicy.com, for example, has mapped 36 locations in Syria that represent the most likely targets for U.S. missiles.
While the goal of the attacks is still unclear, it seems plausible that the strikes will target chemical plants, arms depots, airfields and other military assets.
New eBook - Ubiquitous Tools from Google can Help Emergency Management Personnel Before, During and After a Crisis
[caption id="attachment_4375" align="alignright" width="300"]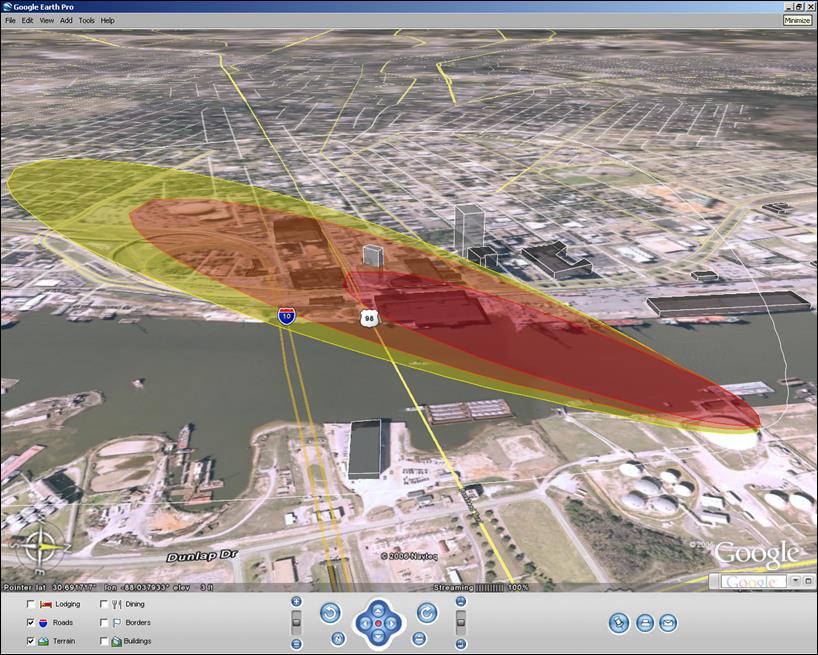 A red and yellow cloud plume overlaid on a Google Earth aerial map helps first responders assess and rehearse for disaster scenarios.[/caption]
Up, up and away! View Any Journey in a Virtual Helicopter via Google Maps
Google has now added a 3D bird's-eye view to its mapping service! Government agencies are using this new feature, which enables users to experience the feeling of being in a helicopter when viewing the path they’re traveling.
Google Earth Makes the World a Better Place. What do you think?
Google believes that a map can make the world a better place. What do you think? To show this, Google launched Google Earth Builder back in August 2011. In the past month, Earth Builder was recently renamed Google Maps Engine. It has been Google’s goal “to provide cloud services to map-makers who need to store, manage, and (probably) publish maps containing insightful data that is of some value to people looking to do some good in the world.” Google Earth Builder Smells As Sweet By Any Other Name
Top Google Maps Power Tips
Whether you use Google Maps to help you get where you need to go or to deliver up-to-date geospatial data quickly to agency employees, it’s a great resource. However, we tend to not take advantage of its full capabilities. What are some other ways you can utilize this great tool? Here are some useful Google Maps power tips:
Geospatial Treasure Chest – The [acronym] Geospatial Archive
GEOINT 2011 is right around the corner. If your’e not familiar with the event, GEOINT is the defacto gathering for defense, intelligence and homeland security communities looking to learn more about the latest trends and technologies in the geointelligence space. To get our readers prepared for what should be a successful GEOINT experience, we thought we’d take a look back at [acronym] Online’s archive of articles on geointelligence.
From using Google Maps to visualize the post-tornado destruction in Joplin, MO to helping urban residents locate HIV/AIDS testing centers, all levels of government can benefit themselves and their constituents by exploiting all the uses that GIS has to offer.
Shortcutting the Geocoding Process for Easy Data Search and Visualization (on the fly)!
This blog was written by guest blogger, Eliot Danner, Principal of Reperio Concepts
The steady pace of innovation in geospatial visualization has given rise to a new problem: the need to geocode increasing quantities of data and the corresponding need to manage and search this data. In this article, I am going to discuss a new way to bring data into geospatial environments and a new way to search and manage this data.
A popular maxim in the geospatial community is “80% of all data contains geospatial information” (or something to that effect). True or not it is certainly the case that a great deal of information can be geocoded and, more importantly, that having this information geocoded, that is to say, visible on a map, can be of value to decision makers.
Google Maps and Local Photographer Team to Visualize the Destruction in Joplin, MO.
This year has truly been the year of tornadoes. As of May 24, there have been 1,208 tornadoes reported in the U.S. in 2011 (about 875 were confirmed). Perhaps the most devastating of theses tornados struck the people of Joplin on Sunday May 22, 2011. The tornado left an estimated 123 people dead, 750 injured, and about 1,500 people missing. According to NOAA “The Joplin tornado is the deadliest since modern recordkeeping began in 1950 and is ranked 8th among the deadliest tornadoes in U.S. history.”
Google has responded to the need to know more about this destructive tornado and visualize the before and after impact of this deadly and unprecedented event. Google Maps now includes a visualization (seen here) of the tornado’ path. The path of the storm can be followed by the fuchsia line. The starting point is marked with red, and the end point is marked with green. The light green area of the map represents the part of the city with scattered reports of damage. The damage is mostly from downbursts and falling debris. The dark green is the area that the tornado caused severe damage and the red area was totally destroyed.